
SMC Structure Mapping Indicator
SMC Structure Mapping Indicator
Overview:
The SMC Structure Mapping Indicator is a premium tool tailored for traders utilizing Smart Money Concepts (SMC). Built on the Tradinghub 3.0 framework, it maps liquidity, market structure, and institutional footprints in real time.
Features:
- Liquidity Mapping with Minor IDM
- Structure Breaks: BOS/CHOCH
- Price Action Concepts: Inducement, Liquidity Sweep, FVG, SCOB
- Suitable for swing and intraday strategies
- Internal/External Structure
- Bar Color Coding: Bullish/Bearish
- External HH, HL, LH, LL zones
Key Concepts:
- CE: 50% of Fair Value Gap
- IOFED: Inside/Outside Fair Value Entry
Chapters:
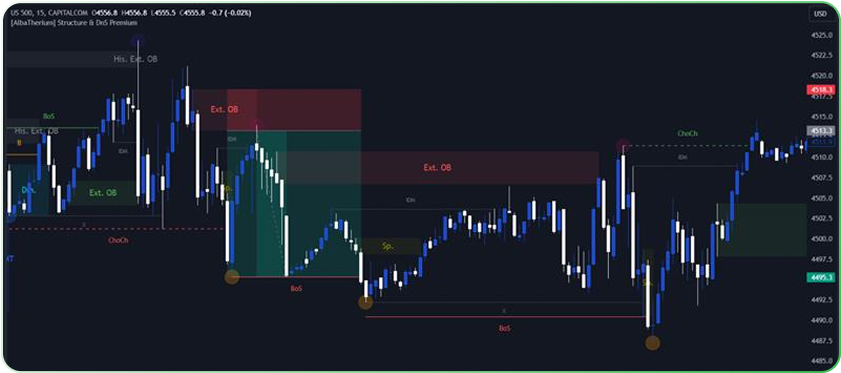
Chapter 1: Structure Mapping
Defines inside bars, pullbacks, and inducements. Helps visualize Bullish Break of Structure (BoS) and Bearish Change of Character (ChoCh).
Chapter 2: Order Blocks
Outlines three key OB types:
- Extreme OB: First & lowest between Major Low/High
- Decisional OB: Most recent below IDM
- Smart Money Trap OBs: Between Extreme and Decisiona
Highlights the role of Fair Value Gaps and liquidity reactions.
Chapter 3: SMART MONEY TRAP (SMT)
Discusses how OBs act as liquidity magnets and entry confirmations. Emphasizes not to rely solely on OBs without further confirmations like inducements or sweeps.
Example:
A high wick triggers buy-side liquidity, leading to a bearish ChoCh. Entry at OB above IDM with SL at OB high and TP at prior structure low.
This indicator offers unmatched clarity in identifying SMC structures and order flow. With in-built transparency and zero gimmicks, it helps traders trade confidently using the most refined concepts in institutional trading.
Disclaimer:
This tool is for educational purposes and market analysis support. It is not a signal provider or guarantee of profits. Use it with independent judgment and other forms of analysis.